
2. Syn-flood
2.1. The network
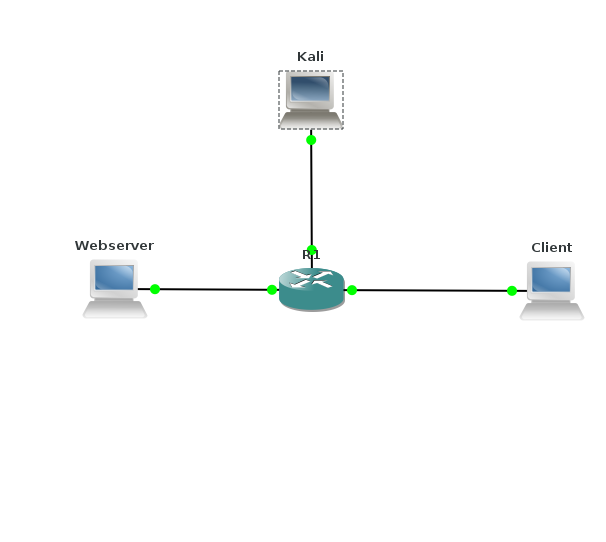
The test for syn-flood uses 3 systems, a web server, a client and an attacker. These are created with Vagrant:
# -*- mode: ruby -*-
# vi: set ft=ruby :
# Vagrantfile API/syntax version. Don't touch unless you know what you're doing!
VAGRANTFILE_API_VERSION = "2"
Vagrant.configure(VAGRANTFILE_API_VERSION) do |config|
config.vm.define :kali do |t|
t.vm.box = "kalilinux/rolling"
t.vm.box_version = "2019.2.0"
t.vm.provider "virtualbox" do |prov|
prov.customize ["modifyvm", :id, "--nic2", "hostonly", "--hostonlyadapter2", "vboxnet1" ]
end
t.vm.provision "shell", path: "./setup.kali.sh"
end
config.vm.define :webserver do |t|
t.vm.box = "ubuntu/trusty64"
t.vm.provider "virtualbox" do |prov|
prov.customize ["modifyvm", :id, "--nic2", "hostonly", "--hostonlyadapter2", "vboxnet2" ]
end
t.vm.provision "shell", path: "./setup.webserver.sh"
end
config.vm.define :client do |t|
t.vm.box = "ubuntu/trusty64"
t.vm.provider "virtualbox" do |prov|
prov.customize ["modifyvm", :id, "--nic2", "hostonly", "--hostonlyadapter2", "vboxnet3" ]
end
t.vm.provision "shell", path: "./setup.client.sh"
end
end
For the web server, a simple out-of-the-box Apache2 is used. Contrary to the ISC2 test, I did not bother to make a nice image. That means that the Apache welcome-page is displayed.
#!/bin/bash
cat <
# _
# __ _____| |__ ___ ___ _ ____ _____ _ __
# \ \ /\ / / _ \ '_ \/ __|/ _ \ '__\ \ / / _ \ '__|
# \ V V / __/ |_) \__ \ __/ | \ V / __/ |
# \_/\_/ \___|_.__/|___/\___|_| \_/ \___|_|
#
EOF
ifconfig eth1 10.128.2.100 netmask 255.255.255.0
route add -net 10.128.0.0 netmask 255.255.0.0 gw 10.128.2.1
apt-get update
apt-get -y install apache2
For the client, a graphical environment is needed. There is no need for an extensive environment and a simple browser will do.
#!/bin/bash
cat <
# _ _ _
# ___| (_) ___ _ __ | |_
# / __| | |/ _ \ '_ \| __|
# | (__| | | __/ | | | |_
# \___|_|_|\___|_| |_|\__|
#
EOF
ifconfig eth1 10.128.3.100 netmask 255.255.255.0
route add -net 10.128.0.0 netmask 255.255.0.0 gw 10.128.3.1
apt-get update
apt-get -y install xinit
apt-get -y install gdm
apt-get -y install fvwm
apt-get -y install midori
apt-get -y install imagemagick
apt-get -y install gnuplot
cp /vagrant/TrackRTT* ~vagrant
The router is a simple 3640 with NM-4E card in it. The router is in this test not important, so almost any (even very old) image will do. Router configuration is kept simple.
enable
config t
int e0/1
ip addr 10.128.1.1 255.255.255.0
int e0/2
ip addr 10.128.2.1 255.255.255.0
int e0/3
ip addr 10.128.3.1 255.255.255.0
no shut
2.2. Reproducing the first syn-flood test
For both the client and Kali, a graphical interface is needed. This is done through the VirtualBox GUI by double-clicking on the machine.
So, first, Midori is used to fetch the home-page on the web server, 10.128.2.100. As expected this works as normal. Next, the hping3 -S --flood -p 80 10.128.2.100 from Kali is started. And sure enough, the web server takes a lot of extra time to respond. Running netstat | grep SYN_RECV on the web server reveals a lot of sessions in this state, mostly ticking towards the 256 lines. And that is odd. Because I have a low-memory virtual machine, the value in /proc/sys/net/ipv4/tcp_max_syn_backlog is 128 and it the number of SYN_RECV sessions should be below that. I have not found an explanation for this.
Because we have gns3 with a router, we can also see the traffic on the web server with wireshark. First we see the syn-request:
Frame 24859: 54 bytes on wire (432 bits), 54 bytes captured (432 bits) on interface 0
Ethernet II, Src: cc:00:26:af:00:02 (cc:00:26:af:00:02), Dst: CadmusCo_3e:03:b7 (08:00:27:3e:03:b7)
Internet Protocol Version 4, Src: 10.128.1.100, Dst: 10.128.2.100
Transmission Control Protocol, Src Port: 6566 (6566), Dst Port: 80 (80), Seq: 0, Len: 0
Source Port: 6566
Destination Port: 80
[Stream index: 12281]
[TCP Segment Len: 0]
Sequence number: 0 (relative sequence number)
Acknowledgment number: 293437713
[Expert Info (Note/Protocol): The acknowledgment number field is nonzero while the ACK flag is not set]
Header Length: 20 bytes
Flags: 0x002 (SYN)
000. .... .... = Reserved: Not set
...0 .... .... = Nonce: Not set
.... 0... .... = Congestion Window Reduced (CWR): Not set
.... .0.. .... = ECN-Echo: Not set
.... ..0. .... = Urgent: Not set
.... ...0 .... = Acknowledgment: Not set
.... .... 0... = Push: Not set
.... .... .0.. = Reset: Not set
.... .... ..1. = Syn: Set
.... .... ...0 = Fin: Not set
[TCP Flags: **********S*]
Window size value: 512
[Calculated window size: 512]
Checksum: 0xeabf [validation disabled]
[Good Checksum: False]
[Bad Checksum: False]
Urgent pointer: 0
And we see the reply from the web server:
Frame 24875: 60 bytes on wire (480 bits), 60 bytes captured (480 bits) on interface 0
Ethernet II, Src: CadmusCo_3e:03:b7 (08:00:27:3e:03:b7), Dst: cc:00:26:af:00:02 (cc:00:26:af:00:02)
Internet Protocol Version 4, Src: 10.128.2.100, Dst: 10.128.1.100
Transmission Control Protocol, Src Port: 80 (80), Dst Port: 6566 (6566), Seq: 0, Ack: 1, Len: 0
Source Port: 80
Destination Port: 6566
[Stream index: 12281]
[TCP Segment Len: 0]
Sequence number: 0 (relative sequence number)
Acknowledgment number: 1 (relative ack number)
Header Length: 24 bytes
Flags: 0x012 (SYN, ACK)
000. .... .... = Reserved: Not set
...0 .... .... = Nonce: Not set
.... 0... .... = Congestion Window Reduced (CWR): Not set
.... .0.. .... = ECN-Echo: Not set
.... ..0. .... = Urgent: Not set
.... ...1 .... = Acknowledgment: Set
.... .... 0... = Push: Not set
.... .... .0.. = Reset: Not set
.... .... ..1. = Syn: Set
[Expert Info (Chat/Sequence): Connection establish acknowledge (SYN+ACK): server port 80]
.... .... ...0 = Fin: Not set
[TCP Flags: *******A**S*]
Window size value: 29200
[Calculated window size: 29200]
Checksum: 0x01a6 [validation disabled]
[Good Checksum: False]
[Bad Checksum: False]
Urgent pointer: 0
Options: (4 bytes), Maximum segment size
Maximum segment size: 1460 bytes
[SEQ/ACK analysis]
[This is an ACK to the segment in frame: 24859]
[The RTT to ACK the segment was: 0.000620000 seconds]
Hint: by right-clicking on a syn-request, you can choose 'Follow' and 'TCP stream' in wireshark. And of course, the hping3 does not answer anymore.
It is also nice to see that hping3 runs out of source ports. Wireshark will mark packets with "TCP Port numbers reused" if there is yet another SYN from this port number.
2.3. Syn cookies
The second exercise was to enable syn-cookies during a SYN attack. In the ISC2 lab environment, that works like charm. When syn cookies are enabled everything is fine and dandy.

Of course, in reality it is not. This exercise promotes a false sense of security: I've enabled syn cookies, so I am safe. That simply is not true. In a more realistic scenario, it would come-out as follows.

Attack starts at 350, sysctl at 600 and end the attack at 800.
Why is that?
That is because ISC2 uses a rather simplistic network. Everything is connected together in one single subnet. But that is not realistic. If your attacker manages to get access to the VLAN or physical switch where your web server is connected, then DoS attacks are the least of your worries.
I had to modify the Tracrtt.sh script to match the difference in network. I also polished away some of the more clumsy stuff. Below is my version of the script.
#!/bin/bash
trap ctrl_c INT
ctrl_c(){
gnuplot <
set terminal png
set term png size 800,400
set boxwidth 2 relative
set grid
set key outside
set datafile separator ","
set output 'TCP_flood_results.png'
set ylabel "Round Trip Time"
set xlabel "Time"
set yrange [0:15]
plot 'tcp-flood-stats.csv' with linespoints ls 1
EOF
cp tcp-flood-stats.csv /vagrant
cp TCP_flood_results.png /vagrant
display TCP_flood_results.png
exit
}
start=$(date +%s)
rm -f tcp-flood-sats.csv
sec=0
while : ; do
now=$(date +%s)
co=$(curl -s --max-time 10 -w '%{http_code}:%{time_total}' -o /dev/null http://10.128.2.100)
response=${co%:*}
if [ "$response" = 200 ] ; then
rtt=${co#*:}
else
rtt=10
fi
sec=$((now - start))
echo "$sec,$rtt">> tcp-flood-sats.csv
sleep 1
done
So, do not be fooled by the fact that a simple kernel setting in Linux solved everything in the ISC2 lab environment.